
Wicked Smart City · engineering prototype
8.8 Mile Example Survey
On September 10, 2026, WSC conducted a night time data collection in Boston, MA using our prototype street-light illumination assessment system. The roof-mounted, multi-sensor platform measures roadway illuminance and color across the travel lane, maps the surrounding environment in 3D with lidar, captures visible imagery for ground-truth context, uses an IR camera to help identify outages, utilizing RTK positioning for precise geolocation. Together, these sensors provide a detailed, drive-through assessment of lighting performance along city streets.
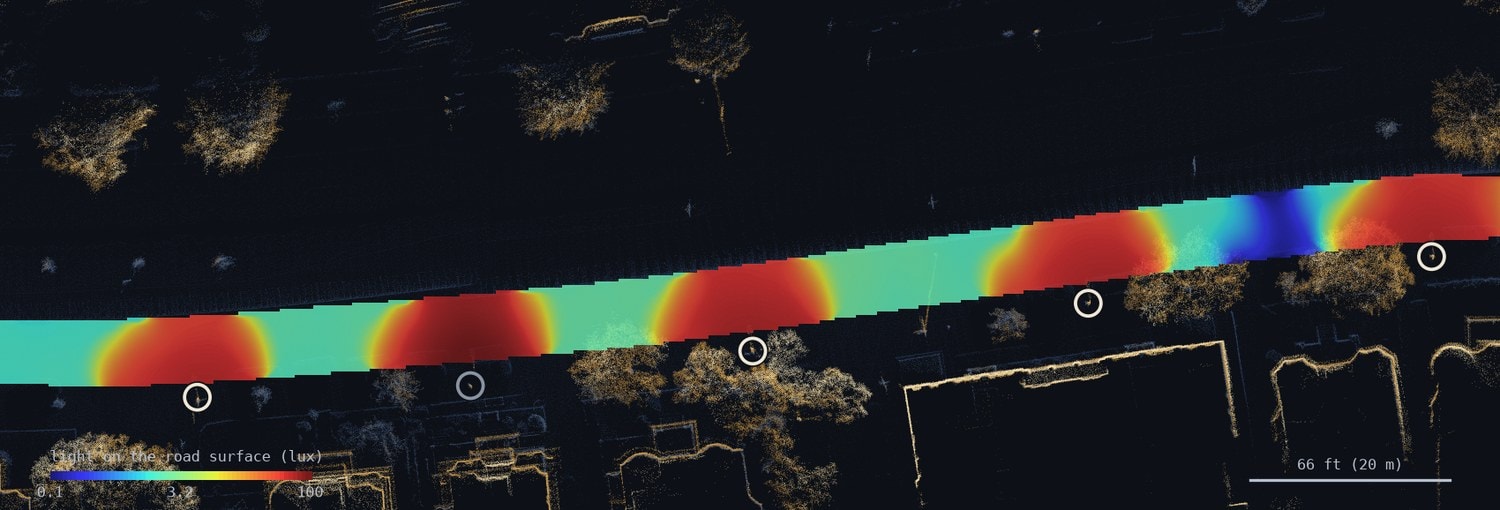
Lux heatmap — full corridor
The false-color lux heatmap below shows the full 8.8-mile surveyed corridor. Each GPS-tagged photometer reading is plotted at its road-surface location and colored by illuminance level. The color scale runs from violet (< 1 lux) through blue, green, yellow, and red (≥ 100 lux), making under-lit segments immediately visible.
Clusters of violet and blue indicate potential areas that fall below the IESNA RP-8 minimum of 0.6 lux for residential streets.
Ground-truth imagery
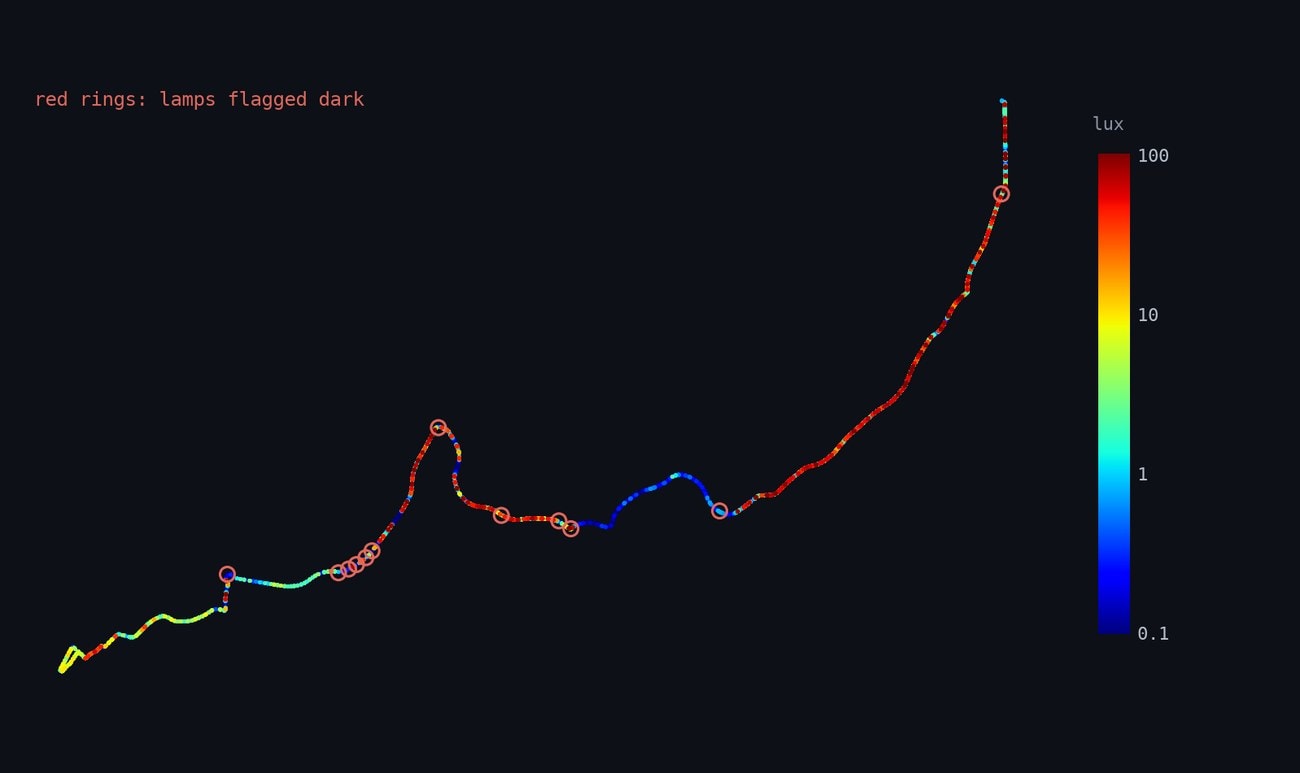
A forward-facing visible-light camera captures continuous video at 15 fps, providing ground-truth context for every photometer reading. Frames are time-stamped and geotagged, allowing any anomalous illuminance reading to be cross-referenced with the corresponding street view.
The image below is a representative frame from the survey corridor, showing the lit environment as seen from the vehicle at survey speed. Fixture positions visible in the image are cross-validated against the lidar-detected pole centroids.
Illuminance profile
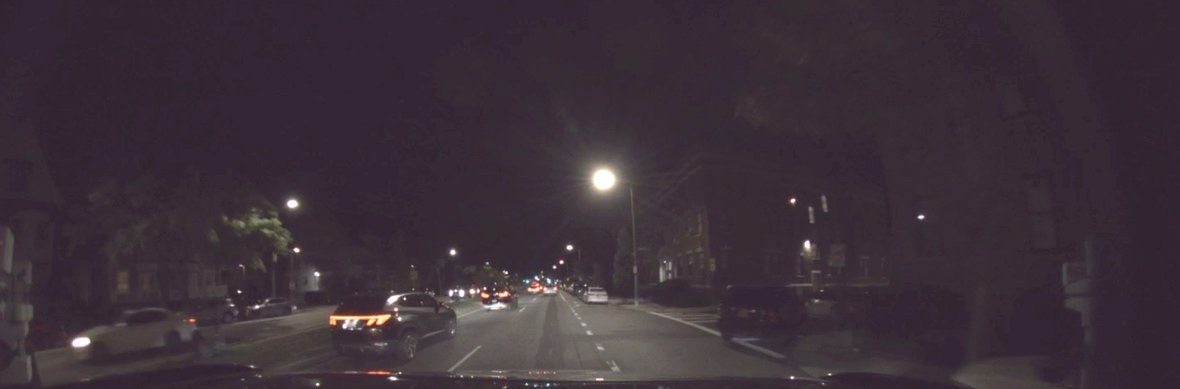
Illuminance is measured continuously along the driven line, with each peak corresponding to a street-light fixture and marked at the location independently determined by the lidar. Over this 1,444 ft (440 m) segment, the system identified 12 lamps with a mean spacing of 127 ft (38.8 m), a mean mounting height of 29.4 ft (9.0 m), and a mean bracket arm length of 7.2 ft (2.2 m)—all derived from the 3D point cloud data. Between fixtures, illuminance falls to a median of 3.0 lux, and 10% of the corridor drops below 1 lux.
These values represent illuminance on the road surface. The photometer bar measures in a plane 5.6 ft (1.70 m) above the pavement, and each reading is projected downward to the surface using the 2D lux field maps and the location of the street light sources detected with the lidar.
Fixture geometry from lidar
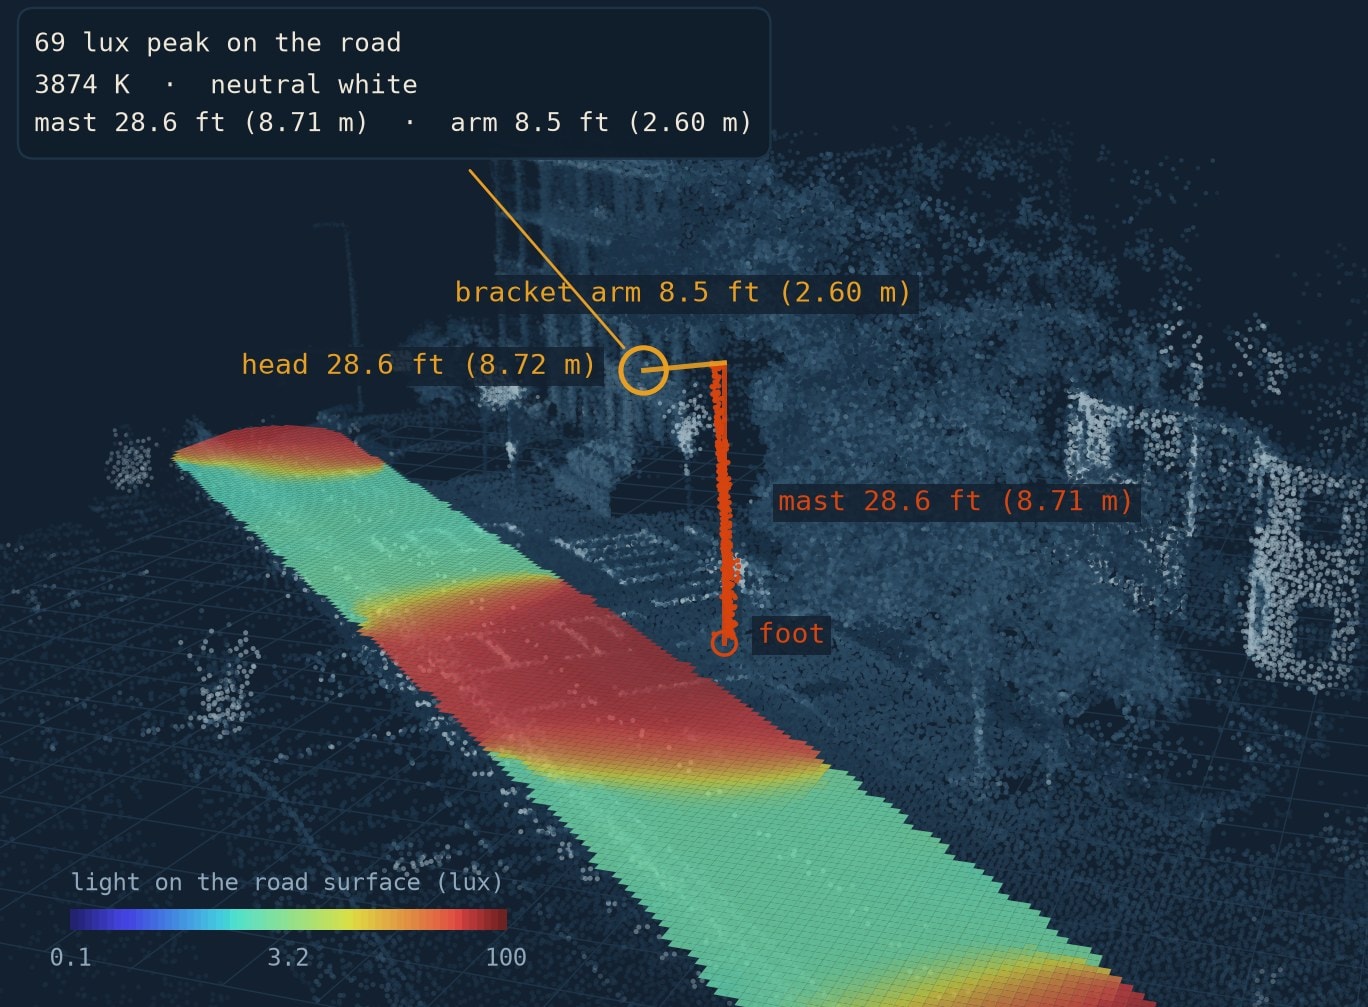
For each detected fixture, the lidar point cloud is used to reconstruct the pole geometry in 3D. The diagram below shows a representative fixture with the pole height, bracket arm length, and luminaire tilt angle extracted automatically from the scan.
These parameters feed directly into the illuminance projection model, allowing the photometer readings to be corrected for sensor height and projected to the road surface without any manual input. The mean mounting height across this survey was 29.4 ft (9.0 m) with a standard deviation of 1.8 ft (0.55 m).
Outage detection — IR camera
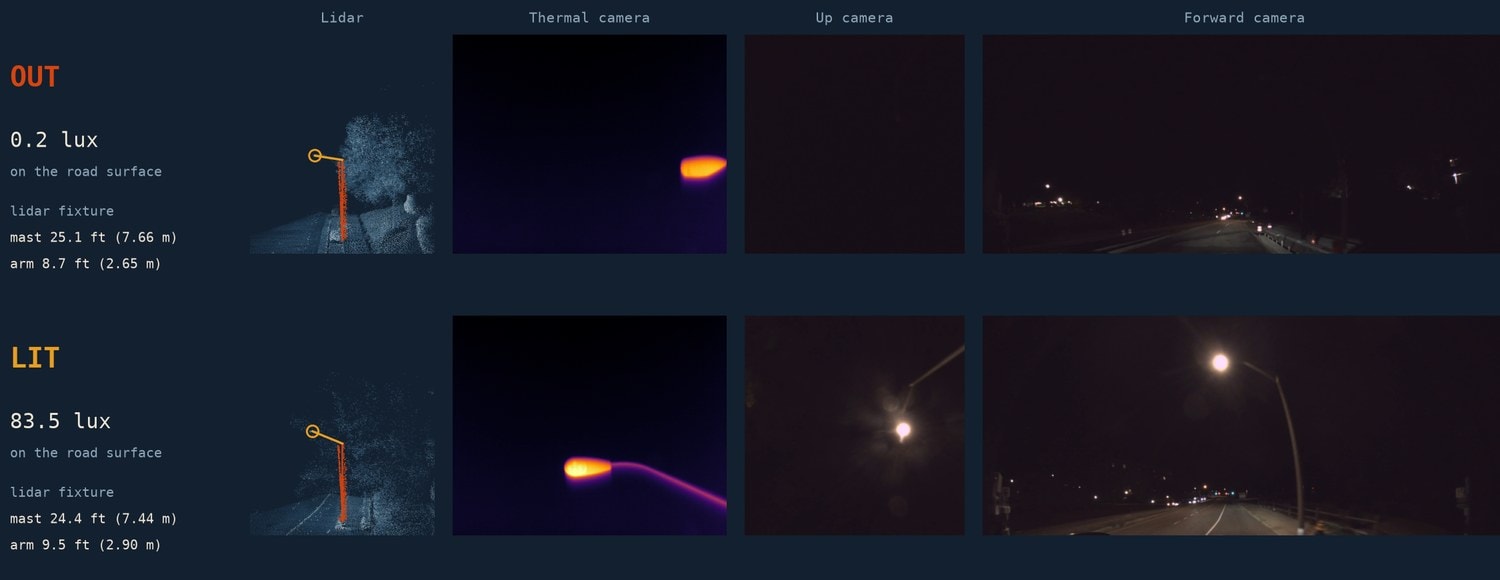
No single sensor decides it. The lidar locates the pole and its bracket arm, and the thermal camera and up camera confirm a fixture head is present. The photometer and the forward camera then show whether that fixture is putting light on the road.
The thermal camera sees both fixtures, but only the lit one glows in the cameras and delivers light to the pavement: 0.2 lux against 83 lux. Together, these technologies verify that a fixture is there and that its light is out.
Color temperature & lamp technology
Lamp technology, inferred from spectrum. Color temperature alone does not separate technologies: within the boxed band 15 lamps share a correlated color temperature (CCT, how warm or cool a white light looks, in kelvin) between 2550 and 2900 K, of which 3 carry almost no blue and 12 carry the blue pump of a white source.
Splitting on blue content gives 15 sodium, 33 warm white and 87 neutral white. Two independent checks agree: chromaticity — a lamp's position on the CIE color chart — puts the sodium group at x 0.51 against 0.40 for the white lamps, and the lidar puts those fixtures on 25.2 ft (7.7 m) poles against 26.9 ft (8.2 m).
Processing pipeline
Raw sensor streams are fused in post-processing to produce georeferenced illuminance maps and fixture inventories.
- 01
Time-sync & ingest
All sensor streams are aligned to a common UTC timeline using the RTK GNSS to set the local clock. Raw photometer, lidar, and camera frames are ingested into a unified data store.
- 02
Lidar processing
Point clouds are registered, motion compensated and used to extract fixture pole positions, mounting heights, and bracket arm lengths.
- 03
Illuminance projection
Photometer readings are projected from sensor height to road surface using the fixture geometry derived from the point cloud, producing a continuous lux profile along the travel lane.
Methodology notes
Data was collected with vehicle travelling at normal traffic speeds. Fixture identification uses a peak-detection algorithm applied to the illuminance profile, cross-validated against lidar-detected pole centroids within a 8 m search radius of the vehicle path.